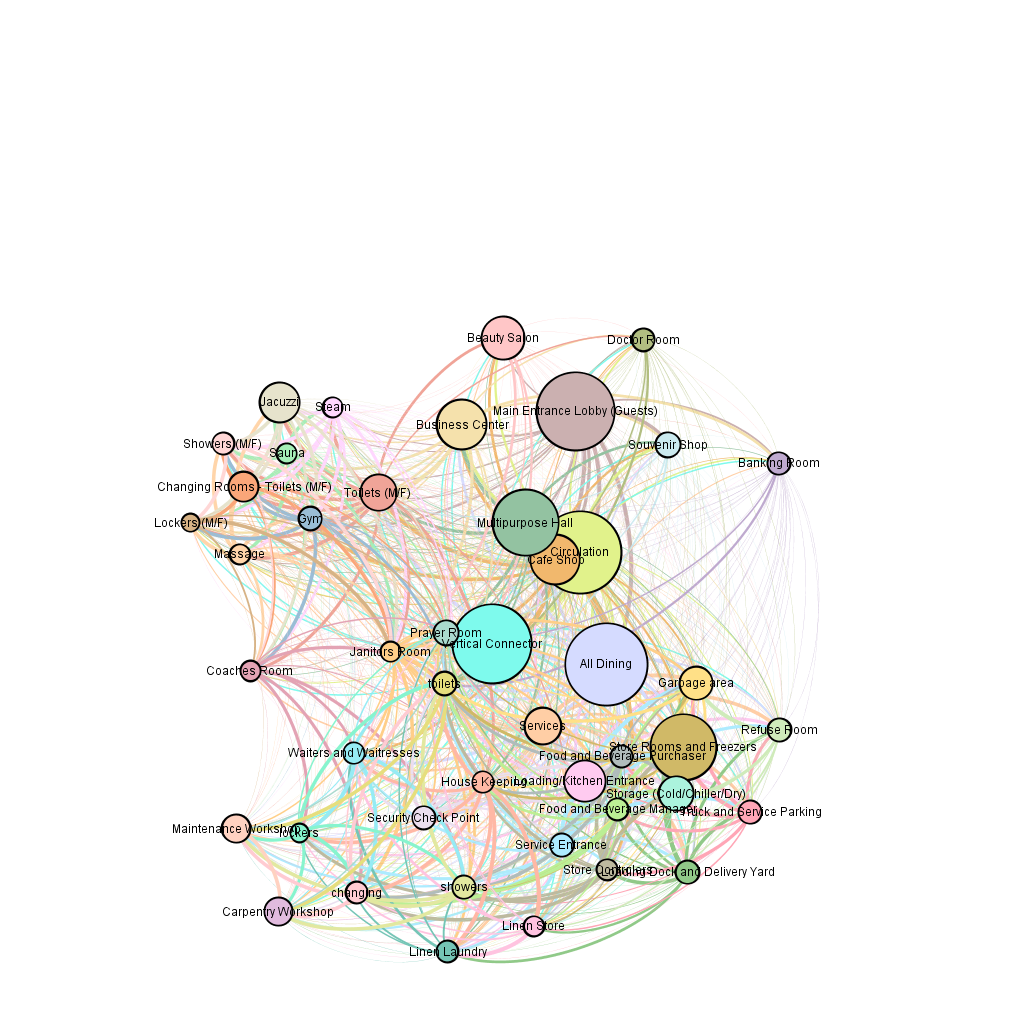
Force atlas method of spatial form-finding using a symmetric weighted adjacency matrix
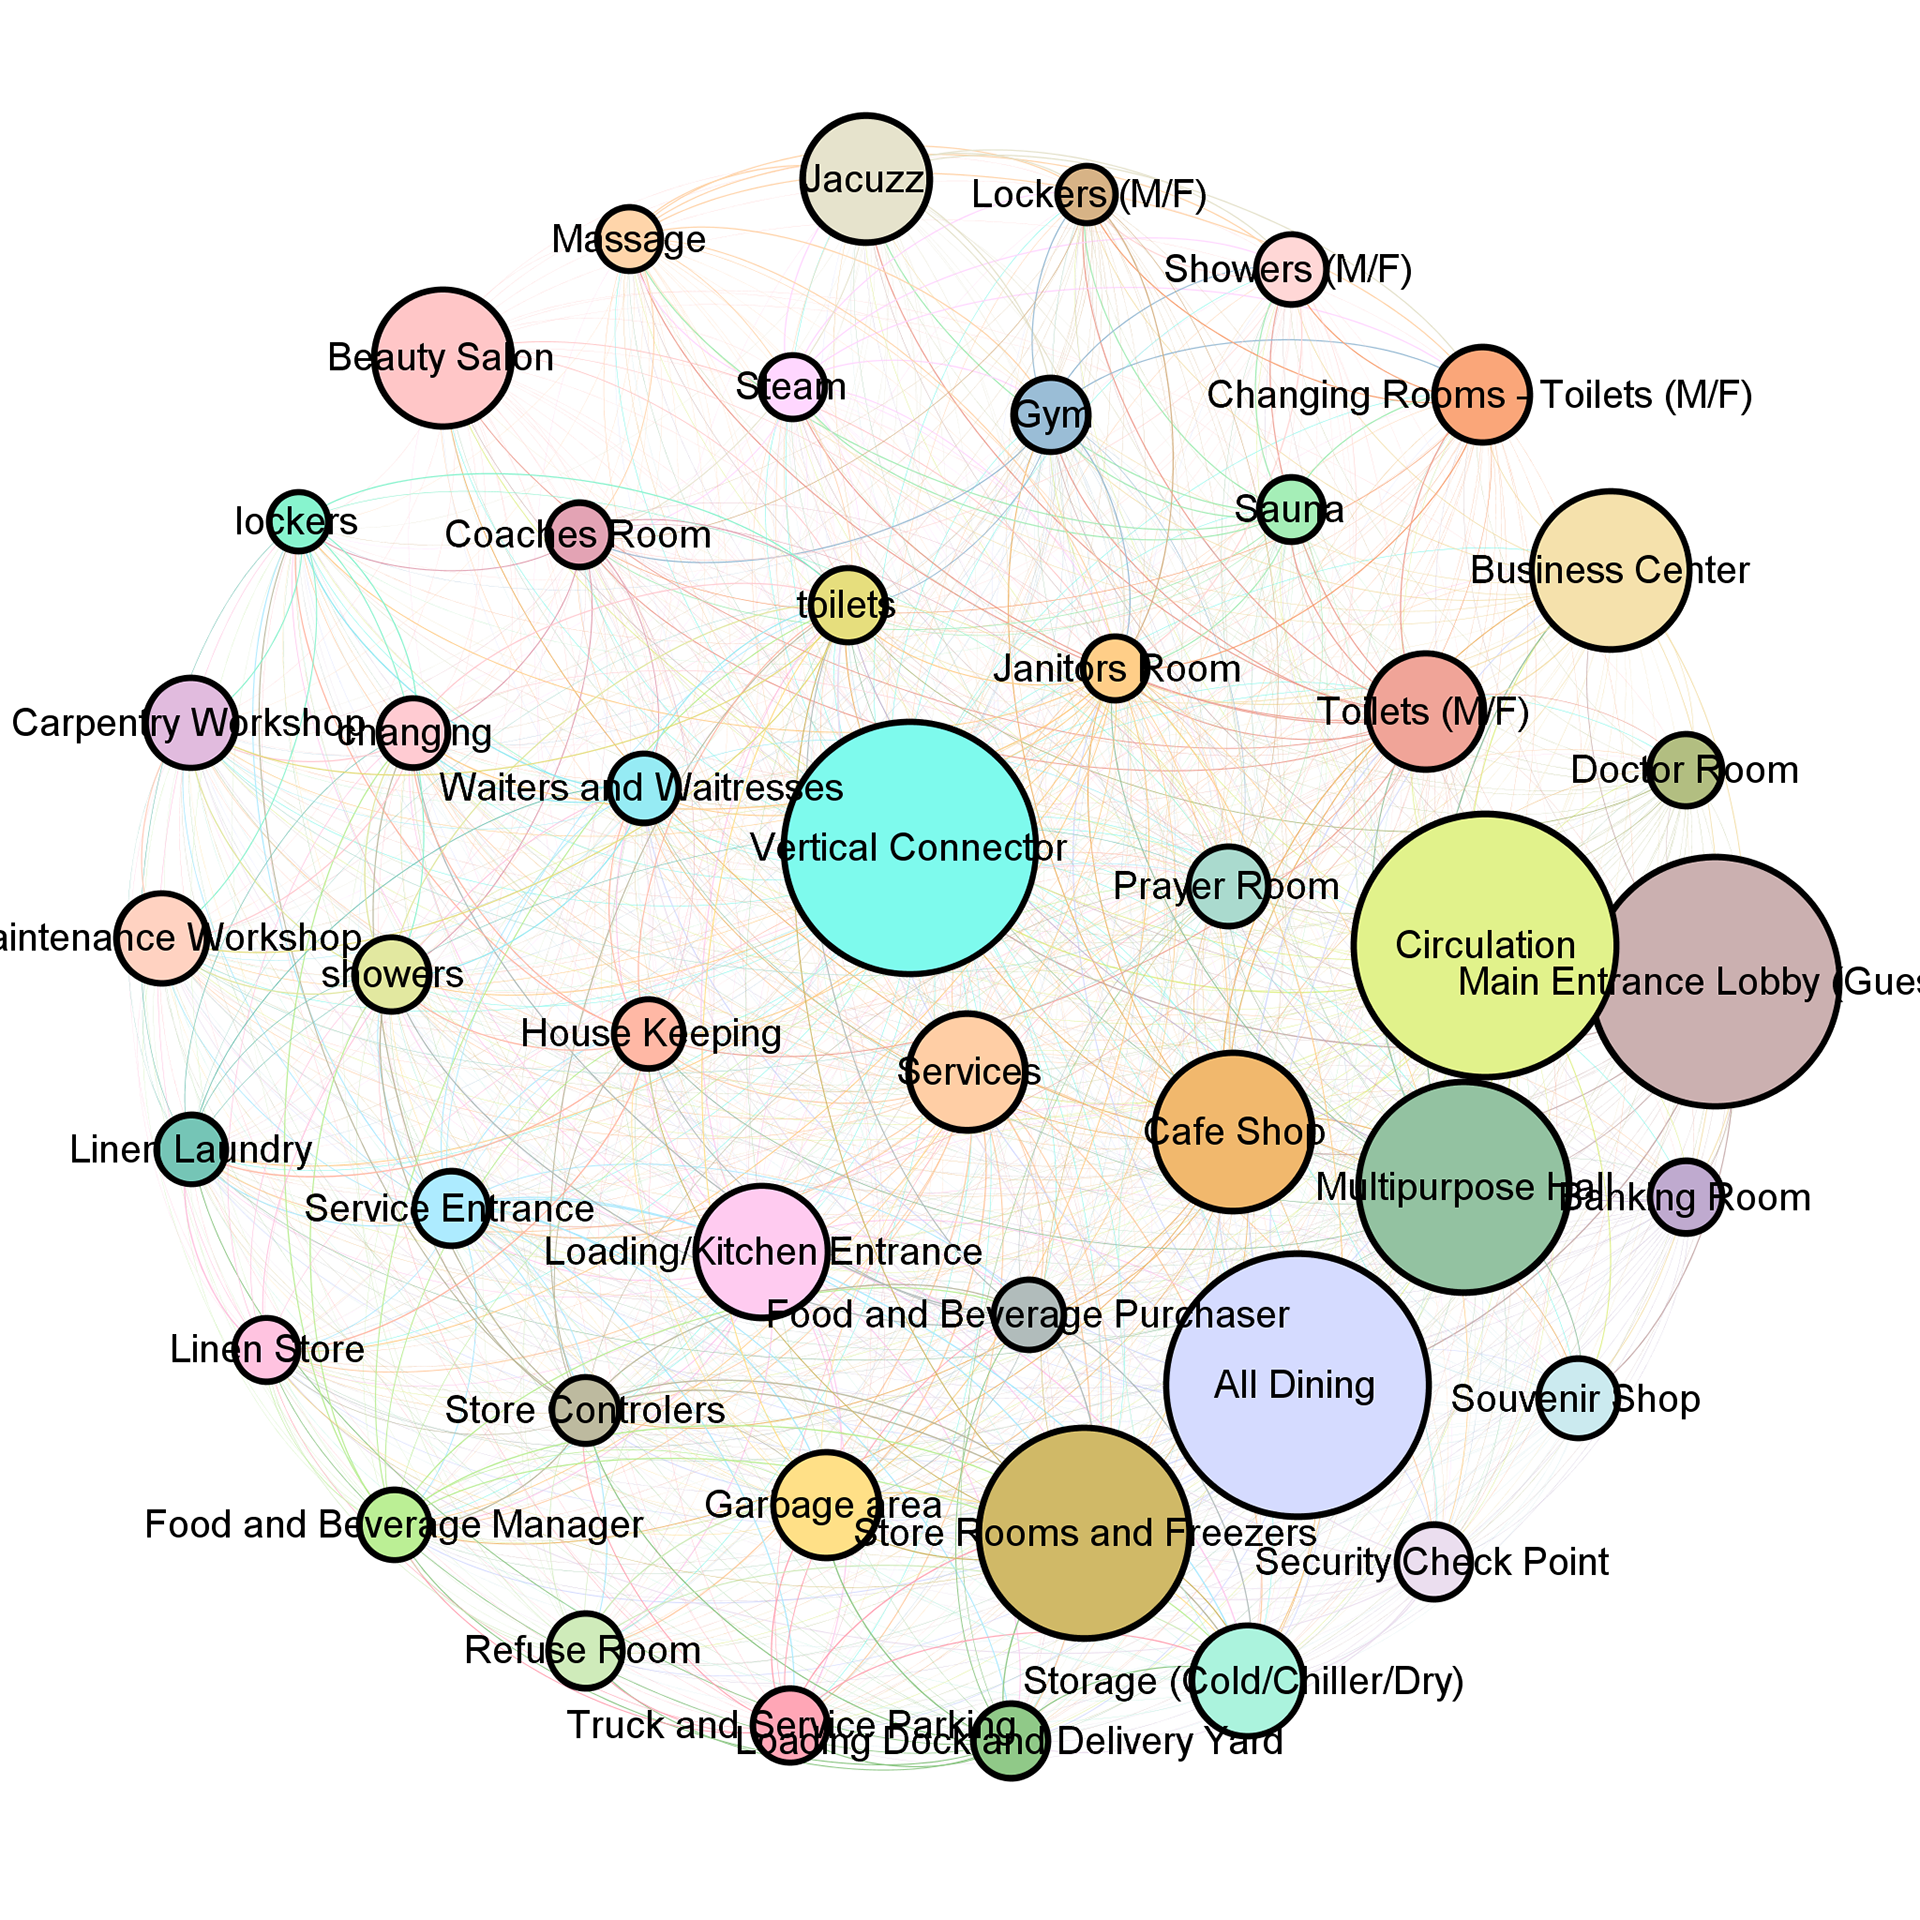
Circular arrangement of spatial quantities
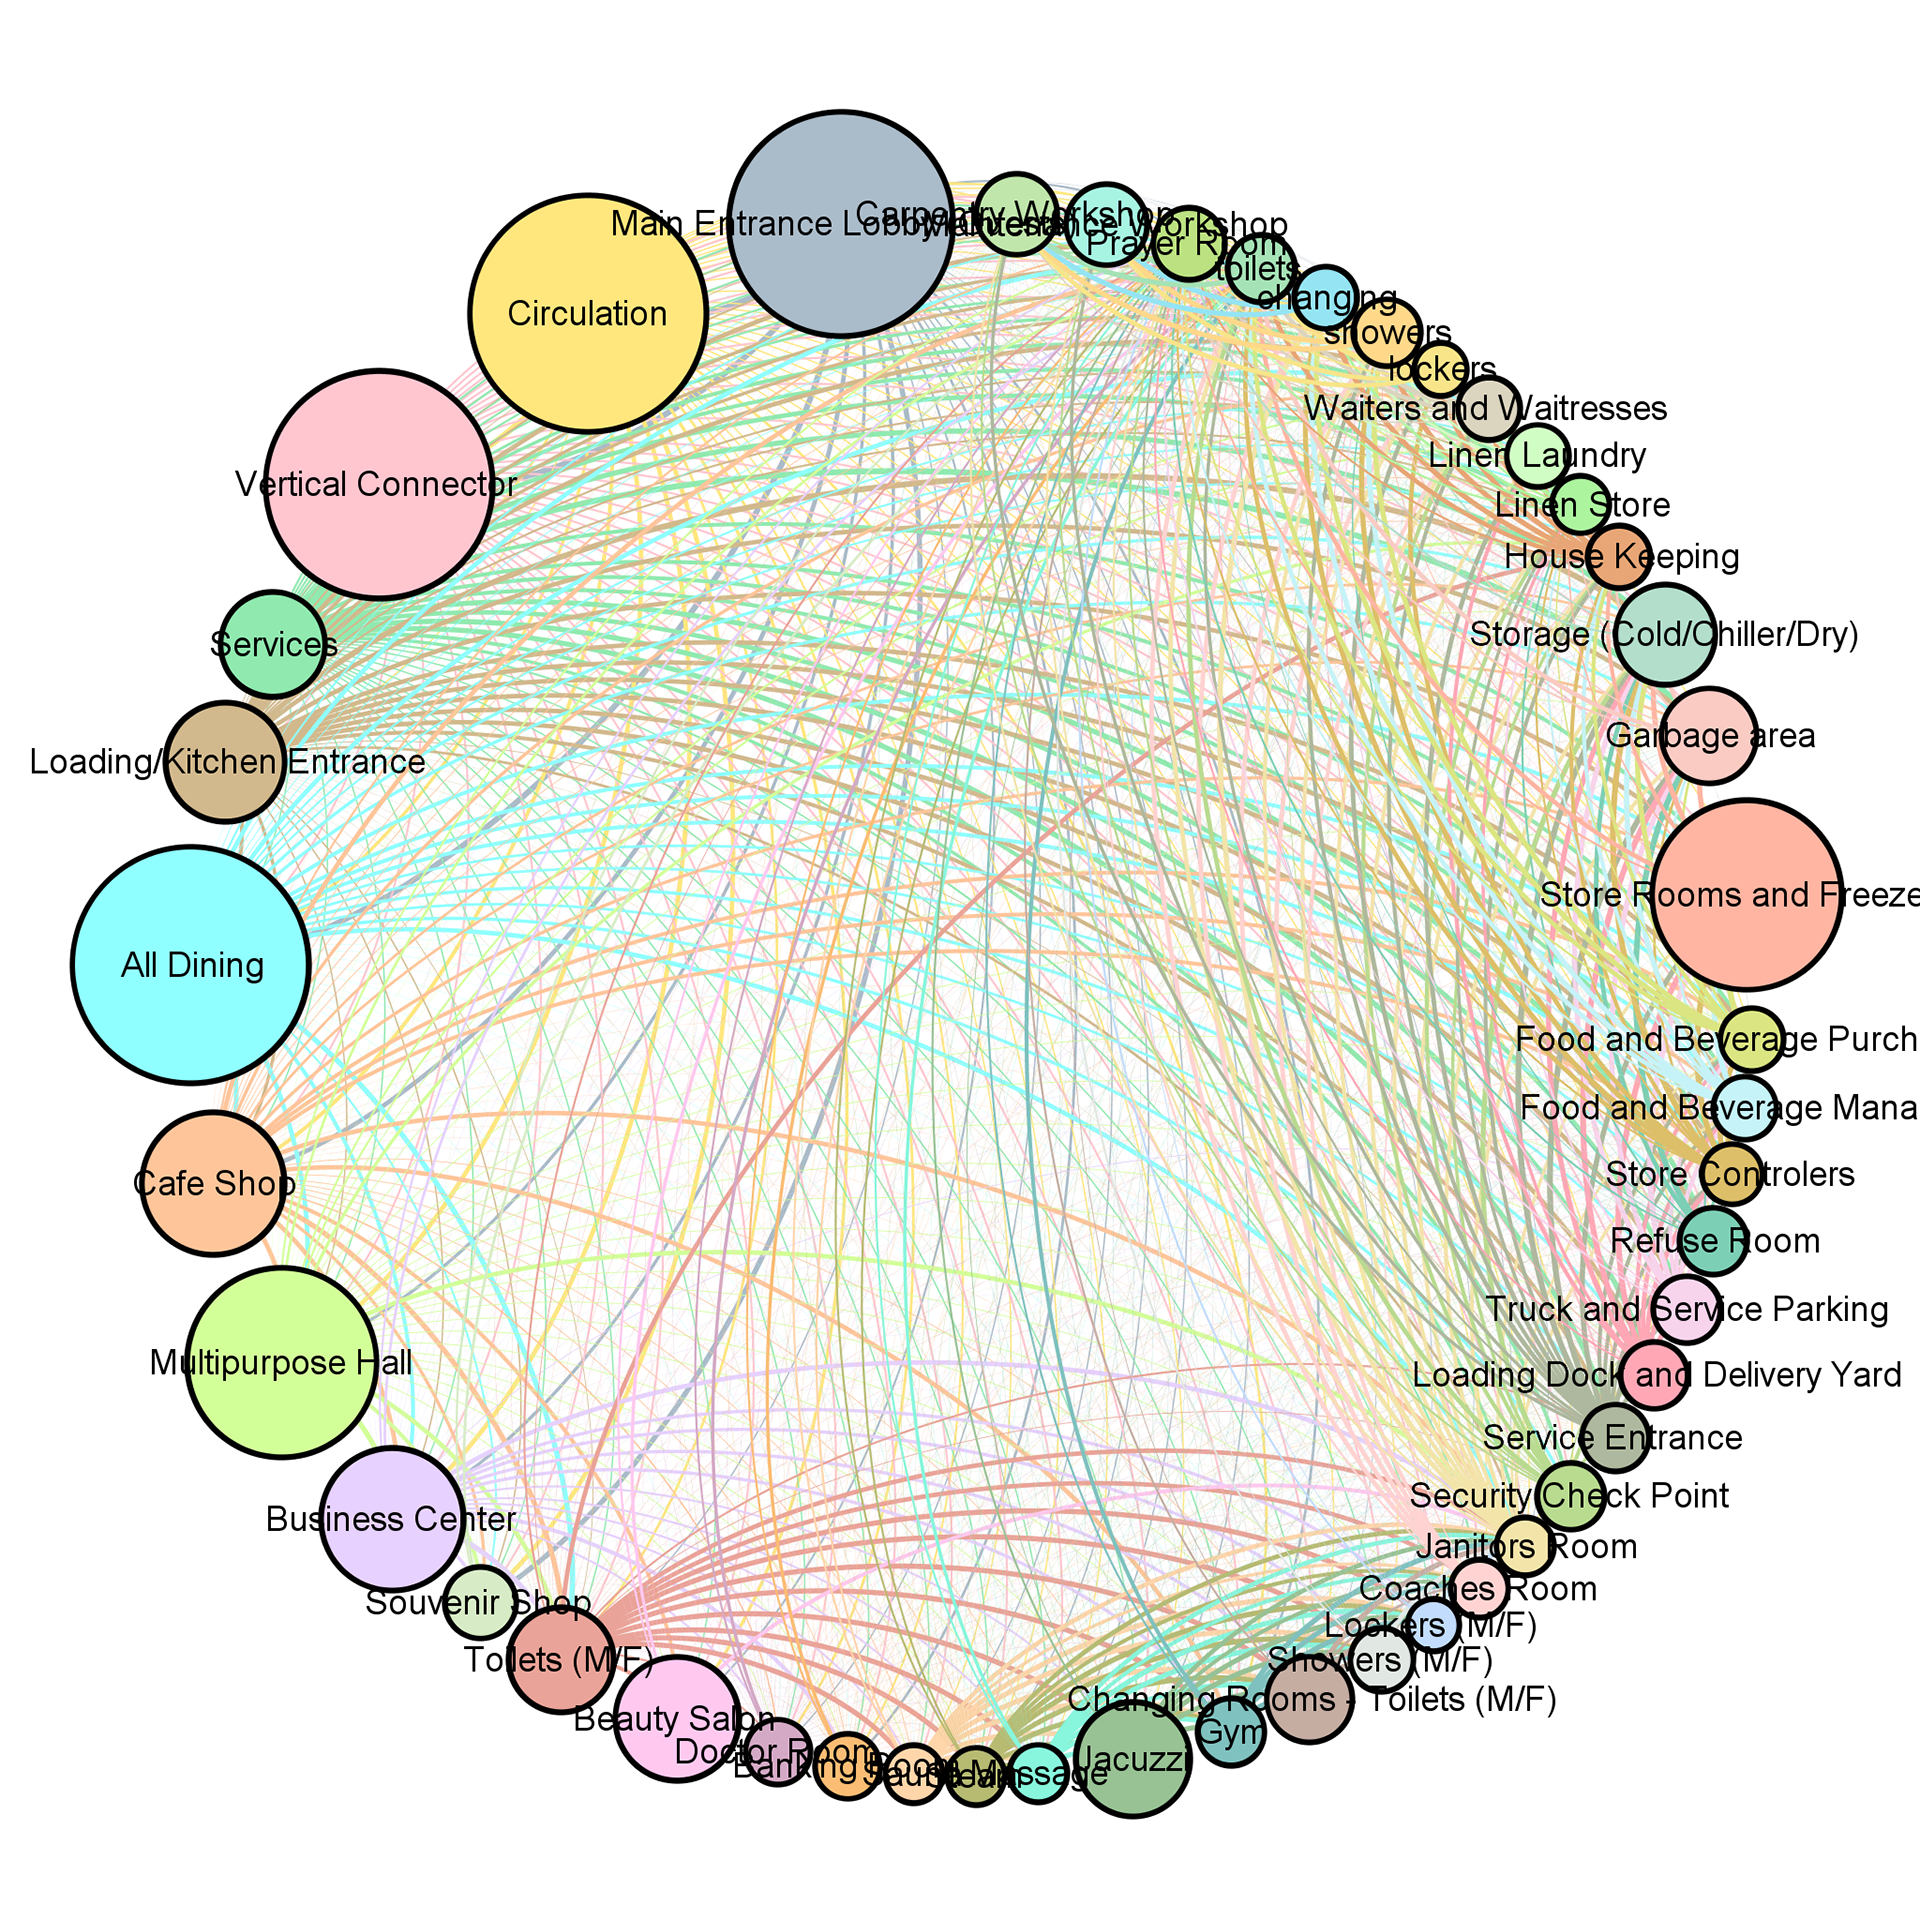
Analysing spatial dependance
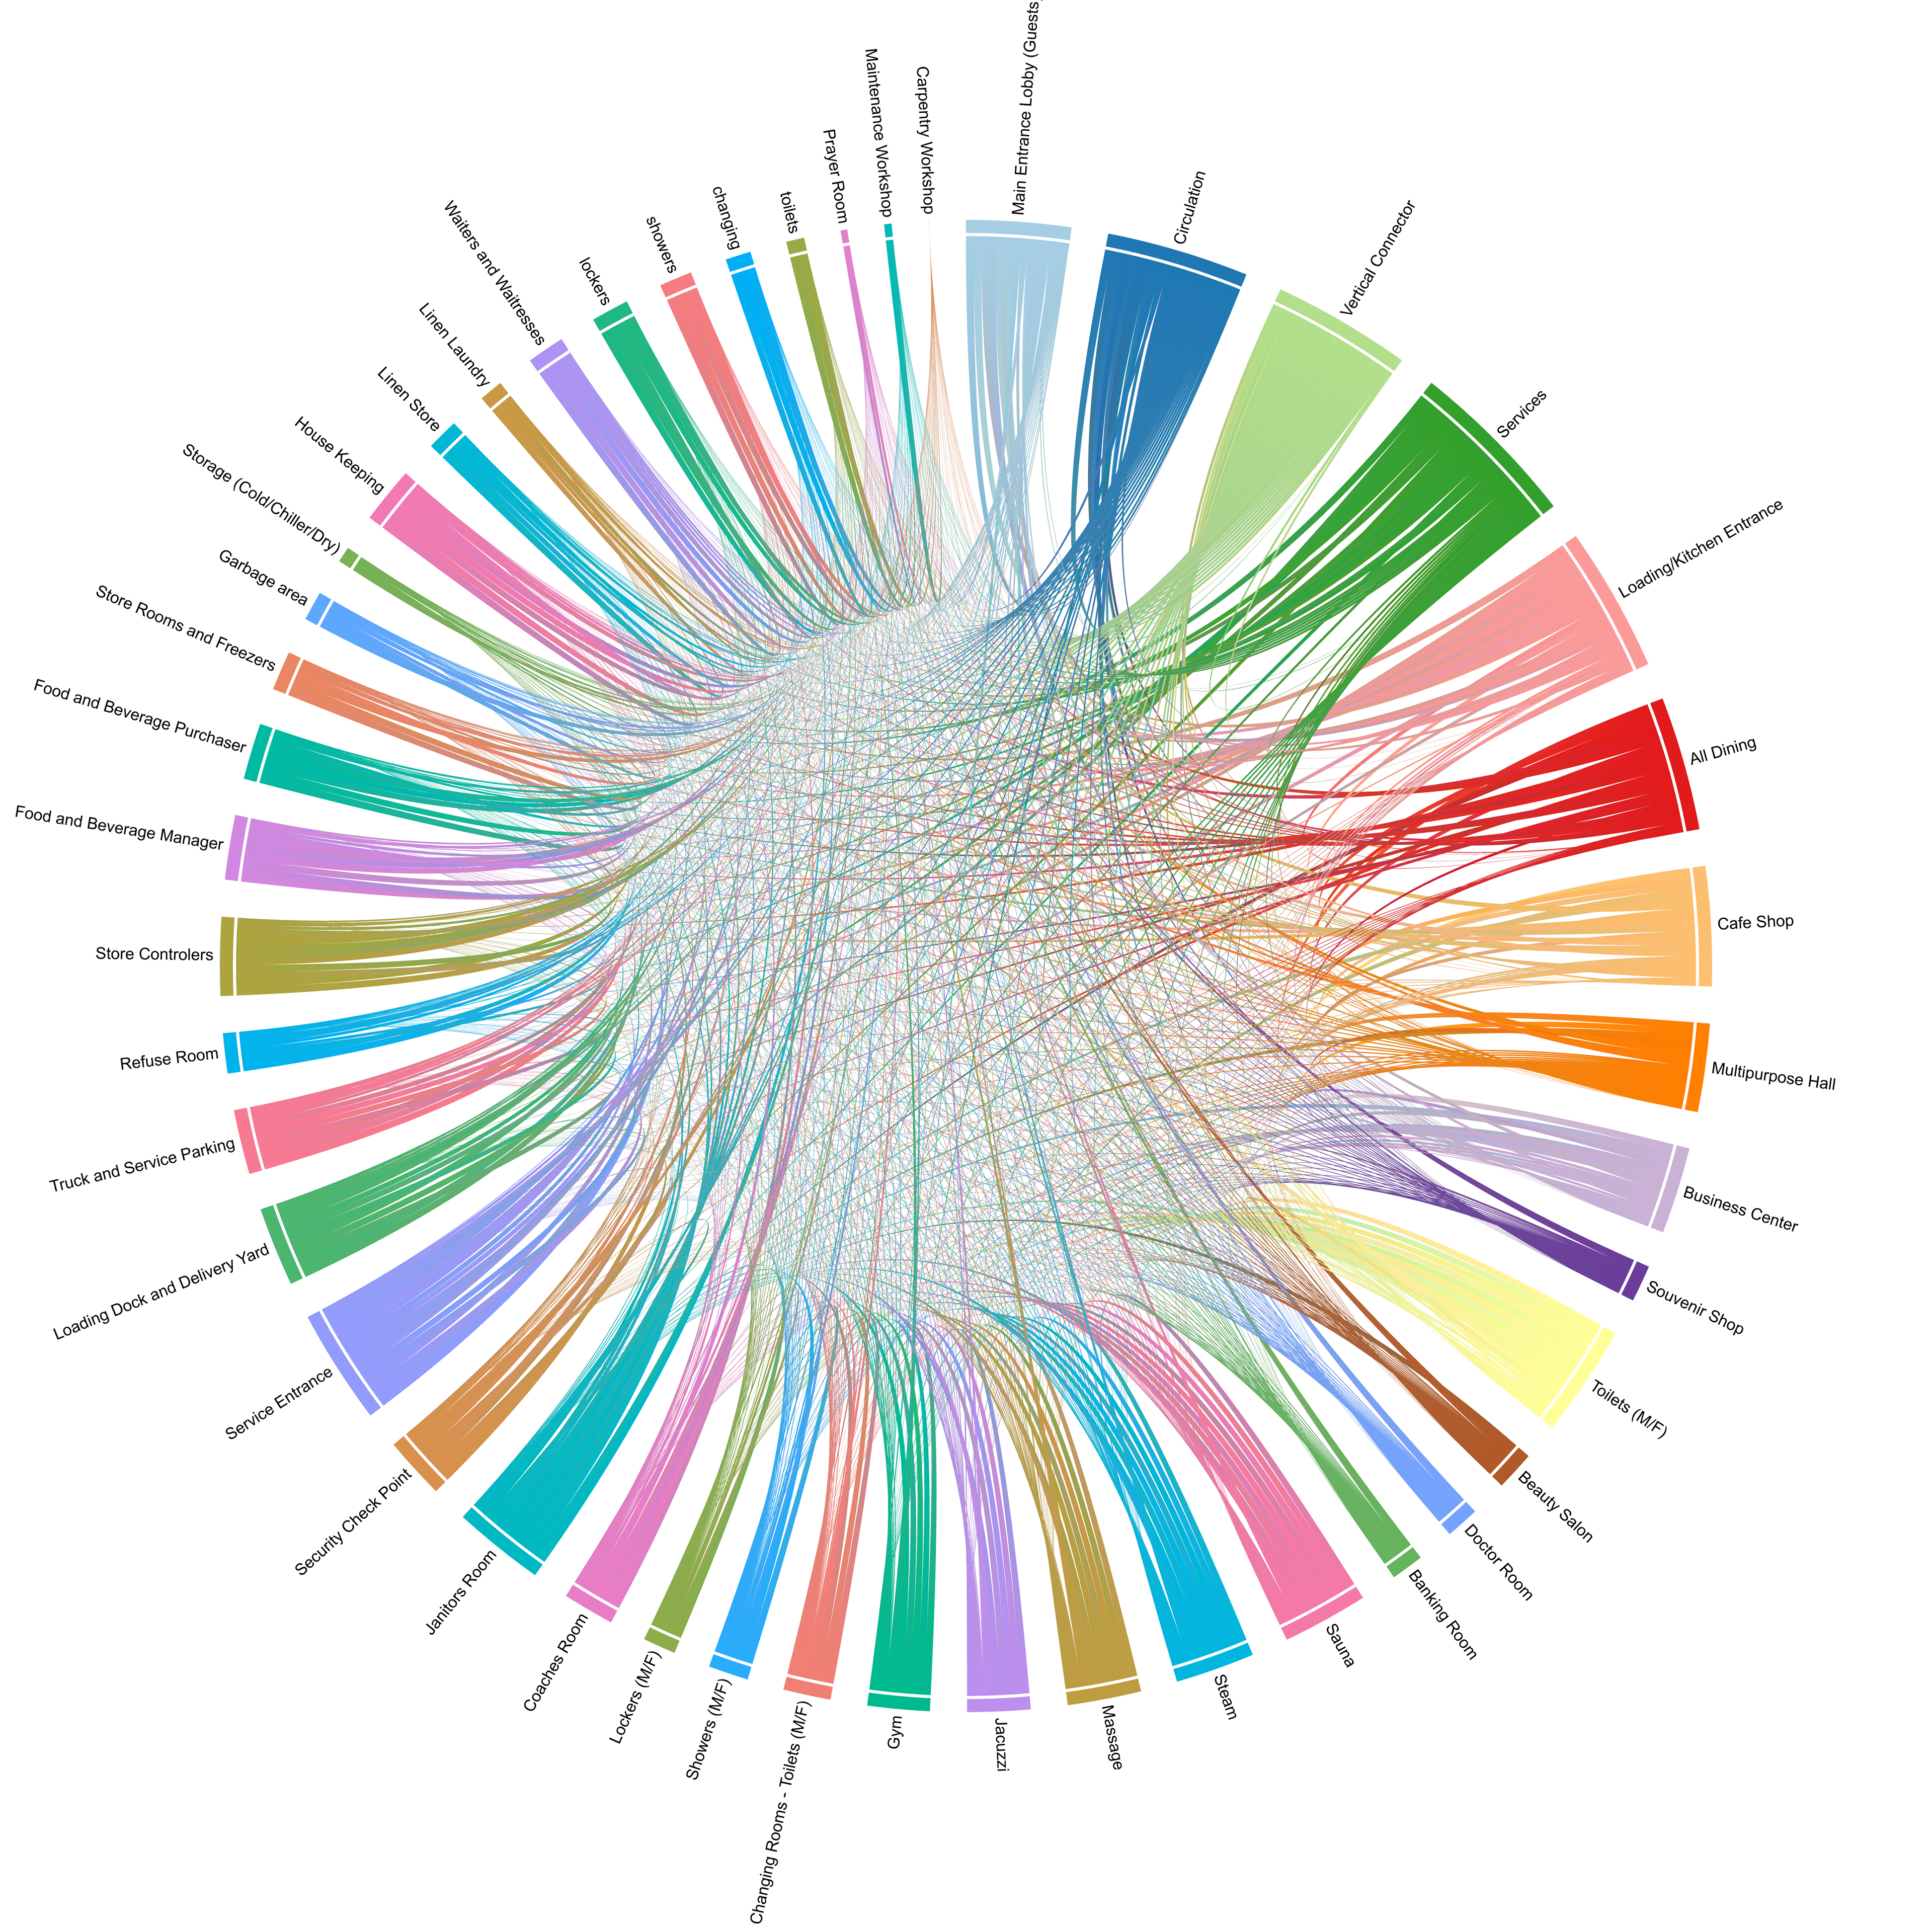

Chord diagram generated using Gephi GDF files using "flourish" , an data online visualization platform
How to achieve this
1 - Construct a symmetric adjacency matrix on excel (leaving 0,0 cell blank and also making sure there are no commas in the names ) Also let’s call the names “ID”
2 - For the weight, use numbers ranging from 1 - 10 where 10 is the highest dependency.
3 - Save the file as a Unicode CSV from excel
4 - Create another file on excel that has the attributes of your spaces, with the names of your spaces under the header ID (let’s start with a simple “area” and “SNo” attribute but you could add more features for sorting and manipulating your data)
5 - Open Gephi and further open your matrix CSV file
5 - Import it as “,” (comma delimited file) and make sure you check “matrix” for the data type
6 - Ensure the import is nondirectional as well (or Gephi adds silly arrows)
7 - Not gonna go into the gephi bit too much but select a force atlas layout and set the force to something high 1000 or 10000 depending on the size of the data and the attraction to a 1000th of that 1 or 10. Go to the data lab and import your excel with the attributes and append to your existing datasheet.
8 - Set the node attributes to use the area for the node size and color scheme to SNo
9 - Play around with all the layout options and finally go to your preview. Once you’re happy with it, export it to a GDF graph file.
the GDF now has the coordinates of the circles and the diameters. as well as the edge connections.
I’ve written a script that converts this to GH geometry (below)
You can use the second half of the GDF files to also create dependency chord diagrams online as shown in the fourth image.
check out https://discourse.mcneel.com/t/space-planning-and-adjacencies/76056/7 for the supporting files.
Cheers!